Finding The Best Areas For Expansion
Custom Analysis
The BBA Market Analysis tool can create custom analyses to research and analyze potential areas for expansion. To access the analysis tool, go to Market Analysis in the sidebar or click here. Common filters to set include Agency (Awarding), NAICS, PSC, Set Aside, and Assistance Type.
Examples of typical analyses that can be used with each type of analysis include:
- Trend: Understand trends in the total dollar volume of contracts or grants
- Shares: Understand the relative importance of agencies, NAICS / PSC codes, or Programs
- Categories: Understand trends in the share of awards over time
- Maps: Understand the geographic dispersion of awards
- Vehicle Rankings: Understand key contract vehicles
- Awardee Rankings: Understand major incumbent Awardees
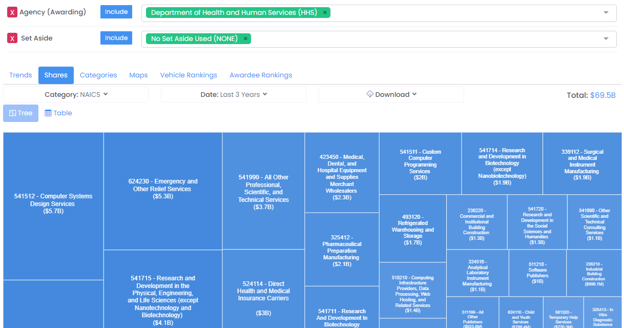
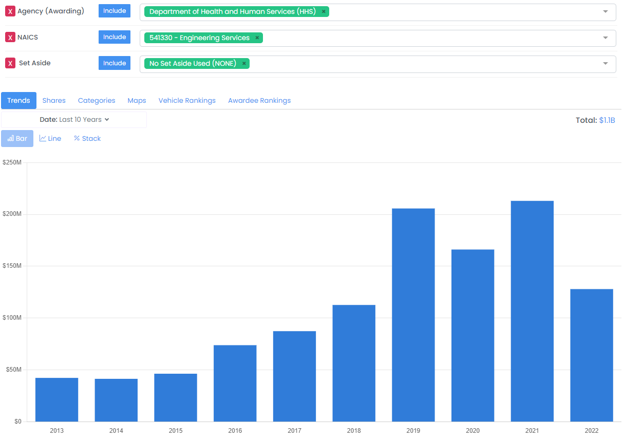
The below shows an example of an analysis to find the most attractive NAICS codes for full & open contracts within HHS.
First looking at the largest NAICS codes:
Then adding the 541330 NAICS code to see the trend in awards over time:
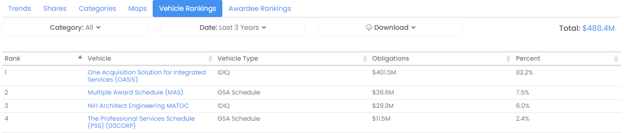
The Vehicles Rankings tab can be used to discover what multi-award contract vehicles are most key for the filtered market:
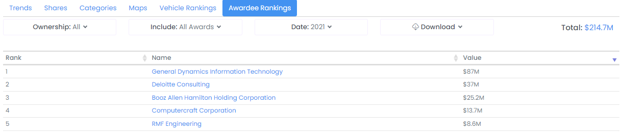
The Awardee Rankings tab can be used to discover who the market leaders in the filtered market are, either to identify potential partners or understand the strengths / weaknesses of the current leaders:
Detail Pages
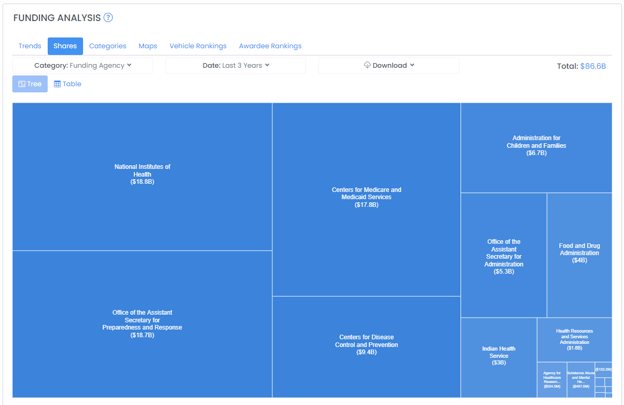
In addition to running custom analyses, the Agencies, Defense Program, Grant Program, PSC, and NAICS detail pages have pre-prepared analyses that can be further customized as needed. These pages can also provide a launching point for understanding recent contracts and grants awarded, active opportunities, and more.
Finding Entrance Points
Vehicles
In some cases, winning a seat on a contract vehicle or schedule or partnering with an awardee that already holds a seat can be a critical early step to expanding into a new agency or capabilities area.
See more details at the below link:
Teaming
Teaming with an awardee with relevant experience can help to build a relationship with a target agency or provide needed past performance to win a contract or grant.
One method to find a strong teaming partner is to look at the largest contractors or grant recipients in the target market using the Awardee Rankings tool in the Market Analysis or by using the Partner Finder tool.
See more details at the below link:
Contracting and Grant Officers
Establishing relationships with contracting or grant officers and learning about their unique preferences can be a key way to successfully enter a new market.
Each Agency page has a listing of the key people at that agency and you can also search for key people on the People search page (Market Intelligence --> People or click here). Additionally, you can find the small business points of contact through the Agency small business directories (Market Intelligence --> Documents or click here).
Finding Opportunities to Pursue
Once you have identified new potential agencies and products and services to pursue, you can set up saved searches with daily alerts for new opportunities in those areas using BBA's Contract and Grant Opportunity and Search tools.
Learn more about how to find relevant opportunities at the below:
Other Considerations
Agency Set-Aside Targets
Federal agencies have different targets for the level of funding set aside for small business contracts. The table below shows small business set-aside targets by federal agency. Depending on your set-aside status, you may want to consider targeting agencies that align with your business status.
Government Fiscal Year 2022 Small Business Contracting Goals by Agency. Source: SBA.
| Agency | Prime Contract Small Business Goals | Prime Small Disadvantaged Business Goal | Prime Service- Disabled Veteran- Owned Small Business Goal | Prime Women Owned Small Business Goal | Prime HUBZone Small Business Goal | Subcontract Small Business Goals | Subcontract Small Disadvantaged Business Goal | Subcontract Service-Disabled Veteran-Owned Small Business Goal | Subcontract Women Owned Small Business Goal | Subcontract HUBZone Small Business Goal |
|---|---|---|---|---|---|---|---|---|---|---|
| Small Business Administration | 65.0% | 55.0% | 3.0% | 5.0% | 3.0% | 39.0% | 5.0% | 3.0% | 5.0% | 3.0% |
| Agriculture, Department Of | 47.0% | 21.5% | 3.0% | 5.0% | 3.0% | 21.0% | 5.0% | 3.0% | 5.0% | 3.0% |
| Interior, Department Of The | 45.0% | 28.0% | 3.0% | 5.0% | 3.0% | 44.0% | 5.0% | 3.0% | 5.0% | 3.0% |
| Office Of Personnel Management | 42.0% | 29.3% | 3.0% | 5.0% | 3.0% | 25.0% | 5.0% | 3.0% | 5.0% | 3.0% |
| Nuclear Regulatory Commission | 40.2% | 27.0% | 3.0% | 5.0% | 3.0% | 40.0% | 5.0% | 3.0% | 5.0% | 3.0% |
| Environmental Protection Agency | 39.5% | 17.8% | 3.0% | 5.0% | 3.0% | 56.0% | 5.0% | 3.0% | 5.0% | 3.0% |
| Commerce, Department Of | 39.0% | 19.0% | 3.0% | 5.0% | 3.0% | 30.0% | 5.0% | 3.0% | 5.0% | 3.0% |
| Treasury, Department Of The | 39.0% | 10.0% | 3.0% | 5.0% | 3.0% | 25.0% | 5.0% | 3.0% | 5.0% | 3.0% |
| Labor, Department Of | 37.8% | 28.0% | 3.0% | 5.0% | 3.0% | 60.0% | 5.0% | 3.0% | 5.0% | 3.0% |
| Homeland Security, Department Of | 34.5% | 17.0% | 3.0% | 5.0% | 3.0% | 43.0% | 5.0% | 3.0% | 5.0% | 3.0% |
| General Services Administration | 34.0% | 21.0% | 3.0% | 5.0% | 3.0% | 22.0% | 5.0% | 3.0% | 5.0% | 3.0% |
| Transportation, Department Of | 34.0% | 20.0% | 3.0% | 5.0% | 3.0% | 46.0% | 5.0% | 3.0% | 5.0% | 3.0% |
| Justice, Department Of | 31.0% | 15.0% | 3.0% | 5.0% | 3.0% | 40.0% | 5.0% | 3.0% | 5.0% | 3.0% |
| State, Department Of | 28.0% | 21.0% | 3.0% | 5.0% | 3.0% | 42.0% | 5.0% | 3.0% | 5.0% | 3.0% |
| Veterans Affairs, Department Of | 26.9% | 10.2% | 3.0% | 5.0% | 3.0% | 17.5% | 5.0% | 3.0% | 5.0% | 3.0% |
| Social Security Administration | 26.0% | 9.3% | 3.0% | 5.0% | 3.0% | 50.0% | 5.0% | 3.0% | 5.0% | 3.0% |
| Health And Human Services, Department Of | 22.9% | 13.1% | 3.0% | 5.0% | 3.0% | 32.5% | 5.0% | 3.0% | 5.0% | 3.0% |
| Dept Of Defense | 22.5% | 9.5% | 3.0% | 5.0% | 3.0% | 32.3% | 5.0% | 3.0% | 5.0% | 3.0% |
| National Science Foundation | 18.0% | 10.7% | 3.0% | 5.0% | 3.0% | 25.0% | 5.0% | 3.0% | 5.0% | 3.0% |
| National Aeronautics And Space Administration | 15.8% | 8.2% | 3.0% | 5.0% | 3.0% | 35.5% | 5.0% | 3.0% | 5.0% | 3.0% |
| Education, Department Of | 14.0% | 8.3% | 3.0% | 5.0% | 3.0% | 37.0% | 5.0% | 3.0% | 5.0% | 3.0% |
| Agency For International Development | 12.5% | 7.4% | 3.0% | 5.0% | 3.0% | 16.0% | 5.0% | 3.0% | 5.0% | 3.0% |
| Housing And Urban Development, Department Of | 6.0% | 6.0% | 3.0% | 5.0% | 3.0% | 28.0% | 5.0% | 3.0% | 5.0% | 3.0% |
| Energy, Department Of | 5.2% | 5.0% | 3.0% | 5.0% | 3.0% | 49.0% | 5.0% | 3.0% | 5.0% | 3.0% |
Agency Openness to New Awards
Some agencies are more likely to award prime awards to new contractors than others. The below table shows the percentage of contracts awarded to contractors new to that agency (by count).
Analysis includes any prime contract award worth more than $20K in GFY2021 made to a parent contractor that had not received an award from that agency in prior years. The above list is limited to the top 25 sub-agencies by total count of awards.
| Agency Name | % of Prime Contracts Awarded to New Contractor |
|---|---|
| All | 6.5% |
| National Park Service [DOI] | 20.1% |
| National Oceanic and Atmospheric Administration [DOC] | 18.3% |
| Bureau of Land Management [DOI] | 16.9% |
| Office of Acquisition Management [DOS] | 13.6% |
| Forest Service [USDA] | 13.4% |
| U.S. Consulates and Embassies [DOS] | 11.9% |
| Offices Boards and Divisions [DOJ] | 11.4% |
| Centers for Disease Control and Prevention [HHS] | 11.3% |
| Indian Health Service [HHS] | 11.1% |
| Coast Guard [DHS] | 11.1% |
| Federal Aviation Administration [DOT] | 10.6% |
| Department of the Air Force [DOD] | 9.4% |
| Department of the Army [DOD] | 9.4% |
| VA Headquarters [VA] | 9.3% |
| Public Buildings Service [GSA] | 8.7% |
| Shared Services Center [NASA] | 8.2% |
| National Institutes of Health [HHS] | 6.6% |
| Bureau of Prisons [DOJ] | 5.8% |
| Drug Enforcement Administration [DOJ] | 5.5% |
| Veterans Health Administration [VA] | 5.4% |
| Department of the Navy [DOD] | 5.4% |
| Agricultural Marketing Service [USDA] | 5.0% |
| United States Transportation Command [DOD] | 3.0% |
| Federal Acquisition Service [GSA] | 1.2% |
| Defense Logistics Agency [DOD] | 0.9% |